SOLIDS FLUX THEORY
Settling
The terms "settling", "sedimentation" are used in
practice for several theoretically different facets of the processes (free and
hindered settling, thickening).
In activated sludge samples, settling can be observed as movement of
liquid-solid interface downwards in time. Settling/thickening velocity can be
measured. The velocity depends on activated sludge concentration, on sludge
characteristics and settling conditions (size and shape of the settling volume,
mixing etc.). In practice, sludge characteristics is measured as sludge volume
index SVI or its modifications. For
additional reading, see Ekama et al. (1997).
|
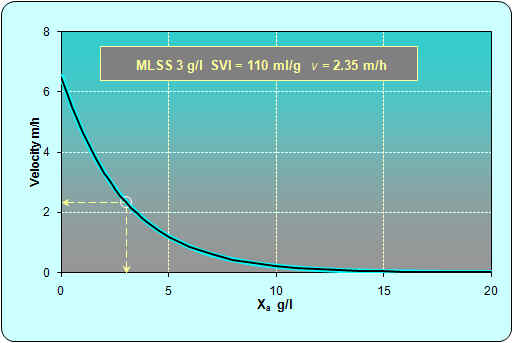
Maximum settling velocity (for
MLSS concentration approaching to zero) is 6-7 m/h.
At typical mixed liquor suspended solids
concentration (MLSS) Xa = 3 g/l and sludge volume index SVI
= 110 ml/g, the zone settling velocity is 2.35 m/h.
If considering
non-uniformity of velocities in the clarifier cross section, maximum
overflow rate (OFR) for successful separation of suspended solids
must be significantly less than 2.35 m/h (see the graph on the
right). Higher OFR would be
possible at smaller Xa and/or SVI.
Additional
restriction is imposed by thickening
requirements (see below). |
|
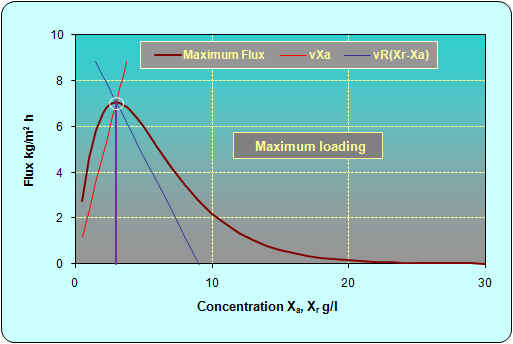
Solids Flux
Multiplication of the settling velocity by the concentration yields the
solids settling
flux J:
|
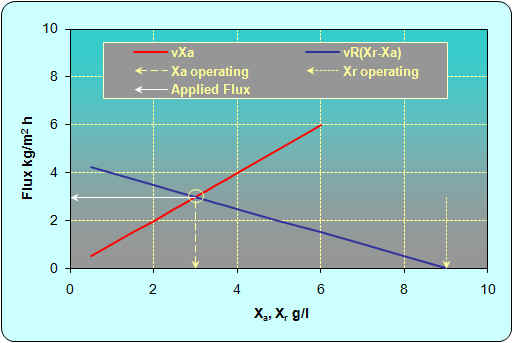
Equation 8 (see Definitions
and Mass Balance)
vXa = vR(Xr
- Xa)
defines the state point (operating point) of
the clarifier, as shown in the figure.
The expressions derived by mass balance are:
|
|
|
|
v Xa "applied flux"
v R(Xr - Xa)
"bulk flux"
v(1+R)Xa
"total flux".
|
|
|
|
|
|
|
|
For design purposes it is usually impossible to measure flux curves of
the appropriate sludge (for instance in a in case of designing
new plant). Thus a generalized
flux curves have to be calculated, based on regression analysis of a large
number of measurements.
|
The generalized flux curve was calculated from
one of the equations published by Daigger
(1995) for parameters: |
|
|
|
R |
v
|
SVI
|
Xa
|
Xr
|
|
|
|
-
|
m/h
|
ml/g
|
g/l
|
g/l
|
|
|
|
0.5
|
1
|
110
|
3
|
9
|
|
|
|
|
|
|
|
|
|
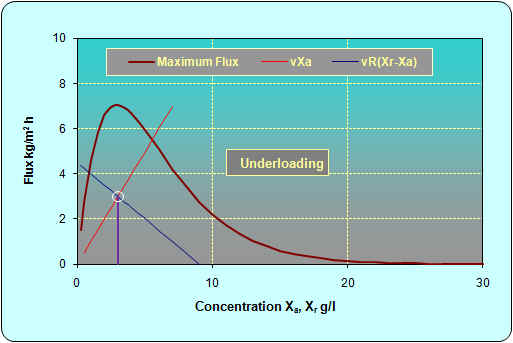
Application of flux curve to real clarifiers can be quite complex. Several
simple recommendations are important:
-
Operating point (white circle at crossing of the red and the blue line) must be below the safe
flux curve.
-
Bulk flux line (blue line) must be below the safe flux curve at any
point to the right from the operating point.
-
Safe design should not be based on the maximum flux curve measured or
generalized but only on about 80 % of the value at any point
(safe flux curve), depending on detailed design of the clarifier (see Ekama
G.A. and Marais G.vR. (1986)).
An example of limiting situations is shown in the following
two figures.
|
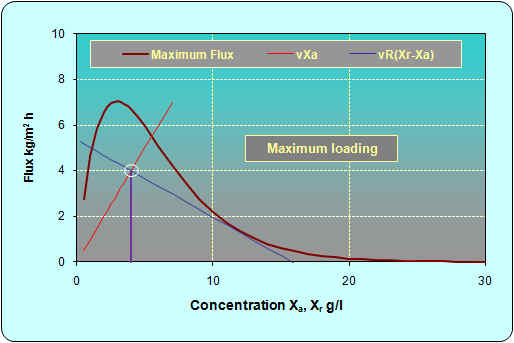
For easy comparison with previous
figures, the maximum flux curve is identical. All parameters used are
the same as before, except increased Xa from 3 g/l to 4 g/l
and decreased R from 0,5 to 0,37. In consequence, Xr
increased to 15.8 g/l. The limiting layer in the clarifier is the
isoconcentration of about 12 g/l. For safe operation, the load will have
to be reduced to 80-90% or the recycle ratio increased (the blue line will turn
right around the state point). The clarifier design details and
short-circuiting have to be considered as well. |
 |
|
Same case but the clarifier is operated at
maximum overflow rate possible, 2.35 m/h. Xr must be decreased to 9
g/l.. |
 |
The main difficulty in estimating the limiting situation is a poor
correlation between SVI (and all its variations) and flux, and further, the
sludge blanket height (which is not a parameter of the flux analysis).